Creating a simpler, faster way to activate and onboard LMS users
ROLE
Lead Product Designer
ACTIVITIES & DELIVERABLES
Data Maps & Gap Analysis
Ecosystem Maps
Customer Experience Journey Maps
Service Blueprints
Middleware Architecture Maps
Wireframes, High-fidelity Prototypes
Developer Feasibility Design Reviews
Handoff Documentation
Education technology companies are ripe for data disparities as they often exist within complex ecosystems — databases, CRMs, servers, interactive learning tools, and roster integration providers. Like many education technology companies today, our client faced the challenge of sustaining their existing ecosystem while integrating new product lines into their platforms.
Alongside a UX researcher and designer in a team augmentation model, we helped our client team analyze internal systems, tools and workflows to identify bottlenecks in their processes. The primary bottlenecks we focused on were license activation and user onboarding to their platform — responsibilities of customer support agents. Customer support agents experience a “month of hell” every year during the back-to-school season as they face a littany of service tickets — teachers with missing roster integrated classes, students struggling to login, districts gaining access to products they never purchased. The more time that customer support agents spent on activating licenses, the less time they had for other customer issues and the worse the overall CX.
System & Process Mapping
Maps tell us where we are and where we are going. They give insight to how information and actions flow throughout an experience. We delivered numerous types of system maps and led workshops with key stakeholders to fill in the blanks.
DEVELOPING TOGETHER
Establishing a relationship with the developers was a critical piece of this entire engagement as they were the ones actually bringing the design solutions to life. Early on, we set the expectation that the developers were to be intimately involved throughout the design process so they could bring up feasibility concerns, data limitations, APIs to leverage, and more.
We used Jira tickets to prioritize and collaborate on user stories and smaller user tasks, linking designs directly. We also provided in-depth documentation through associated Confluence pages for the entire organization to reference.
TESTING TESTING 1, 2, 3
Alongside the UX research and designer, I acted as the scribe throughout usability testing sessions and user interviews. Being able to hear first-hand what confused and delighted the users was key in understanding how they perceived and experienced the UI. From tenured customer support employees familiar with pre-existing workflows to seasonal employees new to the organization, we tested with primary stakeholders to ensure our proposed solutions not only met but anticipated their needs. Afterwards, we synthesized results and made design adjustments where necessary.
DESIGN
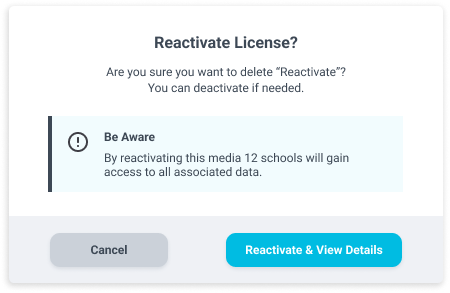
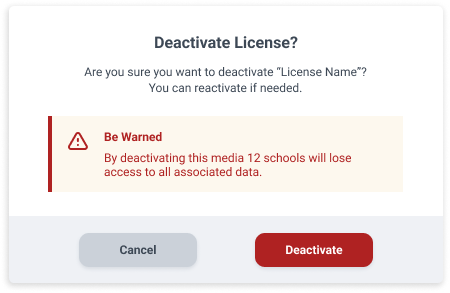
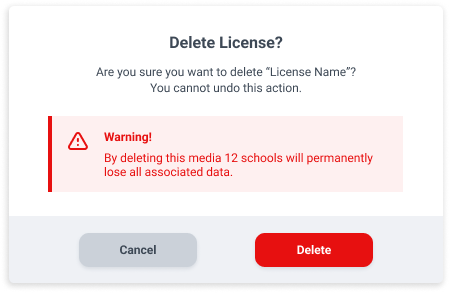
Arguably my favorite part of any project, the design phase of product design is filled with rapid iterations, napkin sketches of wires, brainstorming sessions for the small components to the larger experience. Every touchpoint and interaction must be carefully crafted with data driving it all. We created a guided activation process with three discrete steps for users to activate a license for a school or a district as a whole. We folded in the functionality of two licensing tools into one interface, decreasing the number of separate windows open for users and time to activate.

Redesigned Login Screen

Former Login Screen
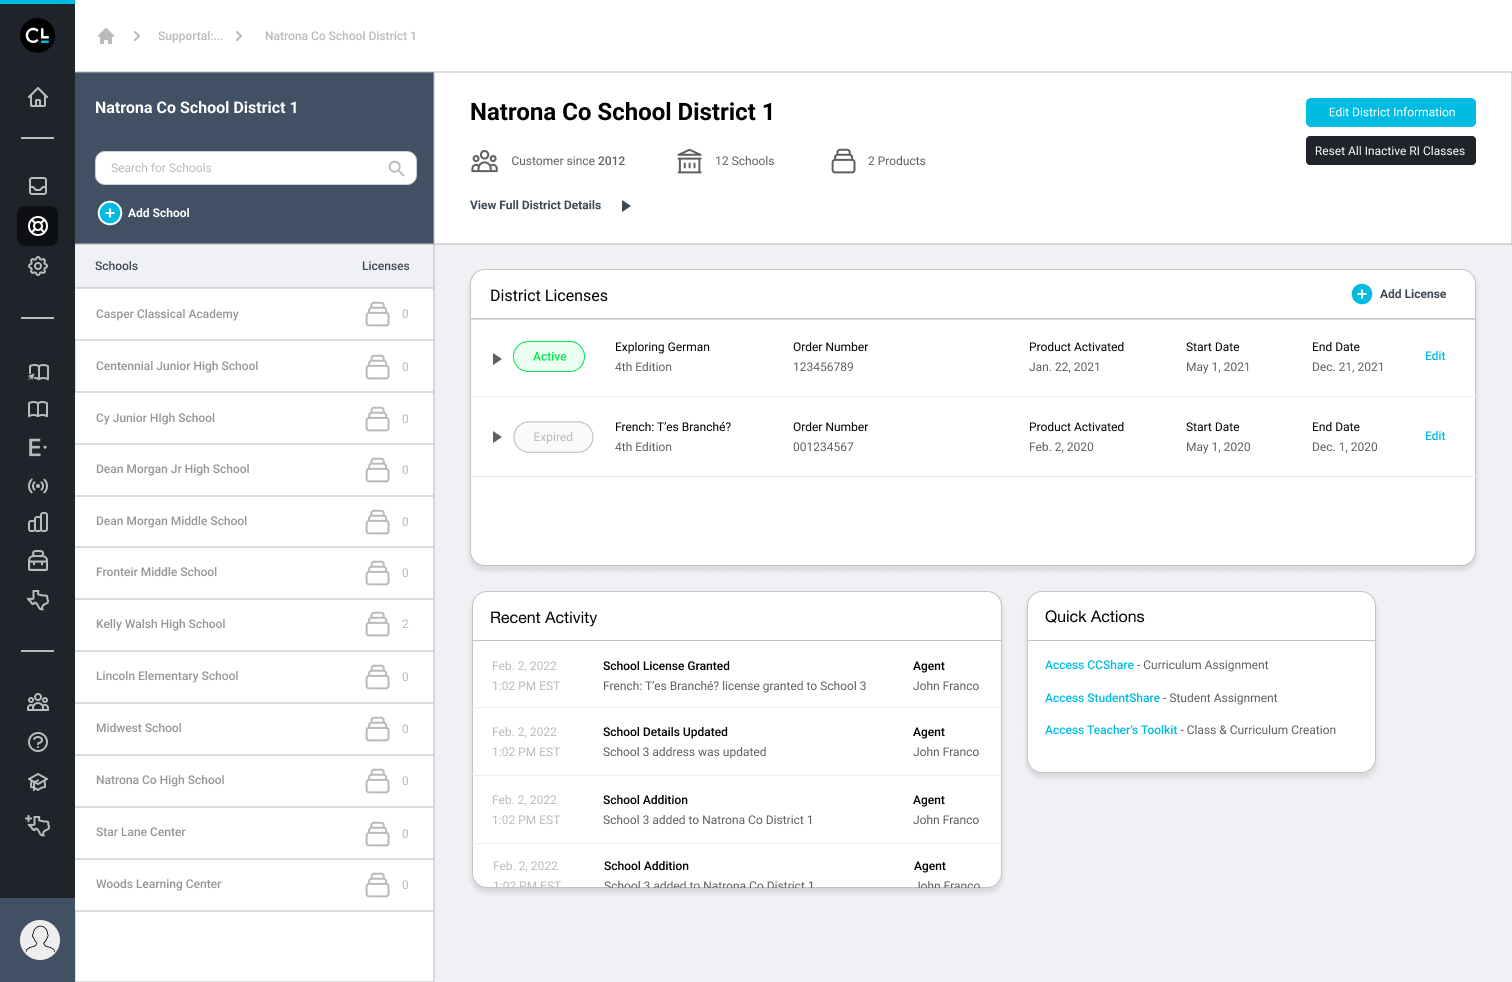
Course Activation Interface